
Peer Income and Spending Comparison Webview
A detachable peer income and spending webview, no app review
A screen detachable at any time
The job was to add one new screen to a mobile app that was already live. The app already had users' card statement data, and the new screen compares that data against the user's age group to show how much they earn and how much they spend.
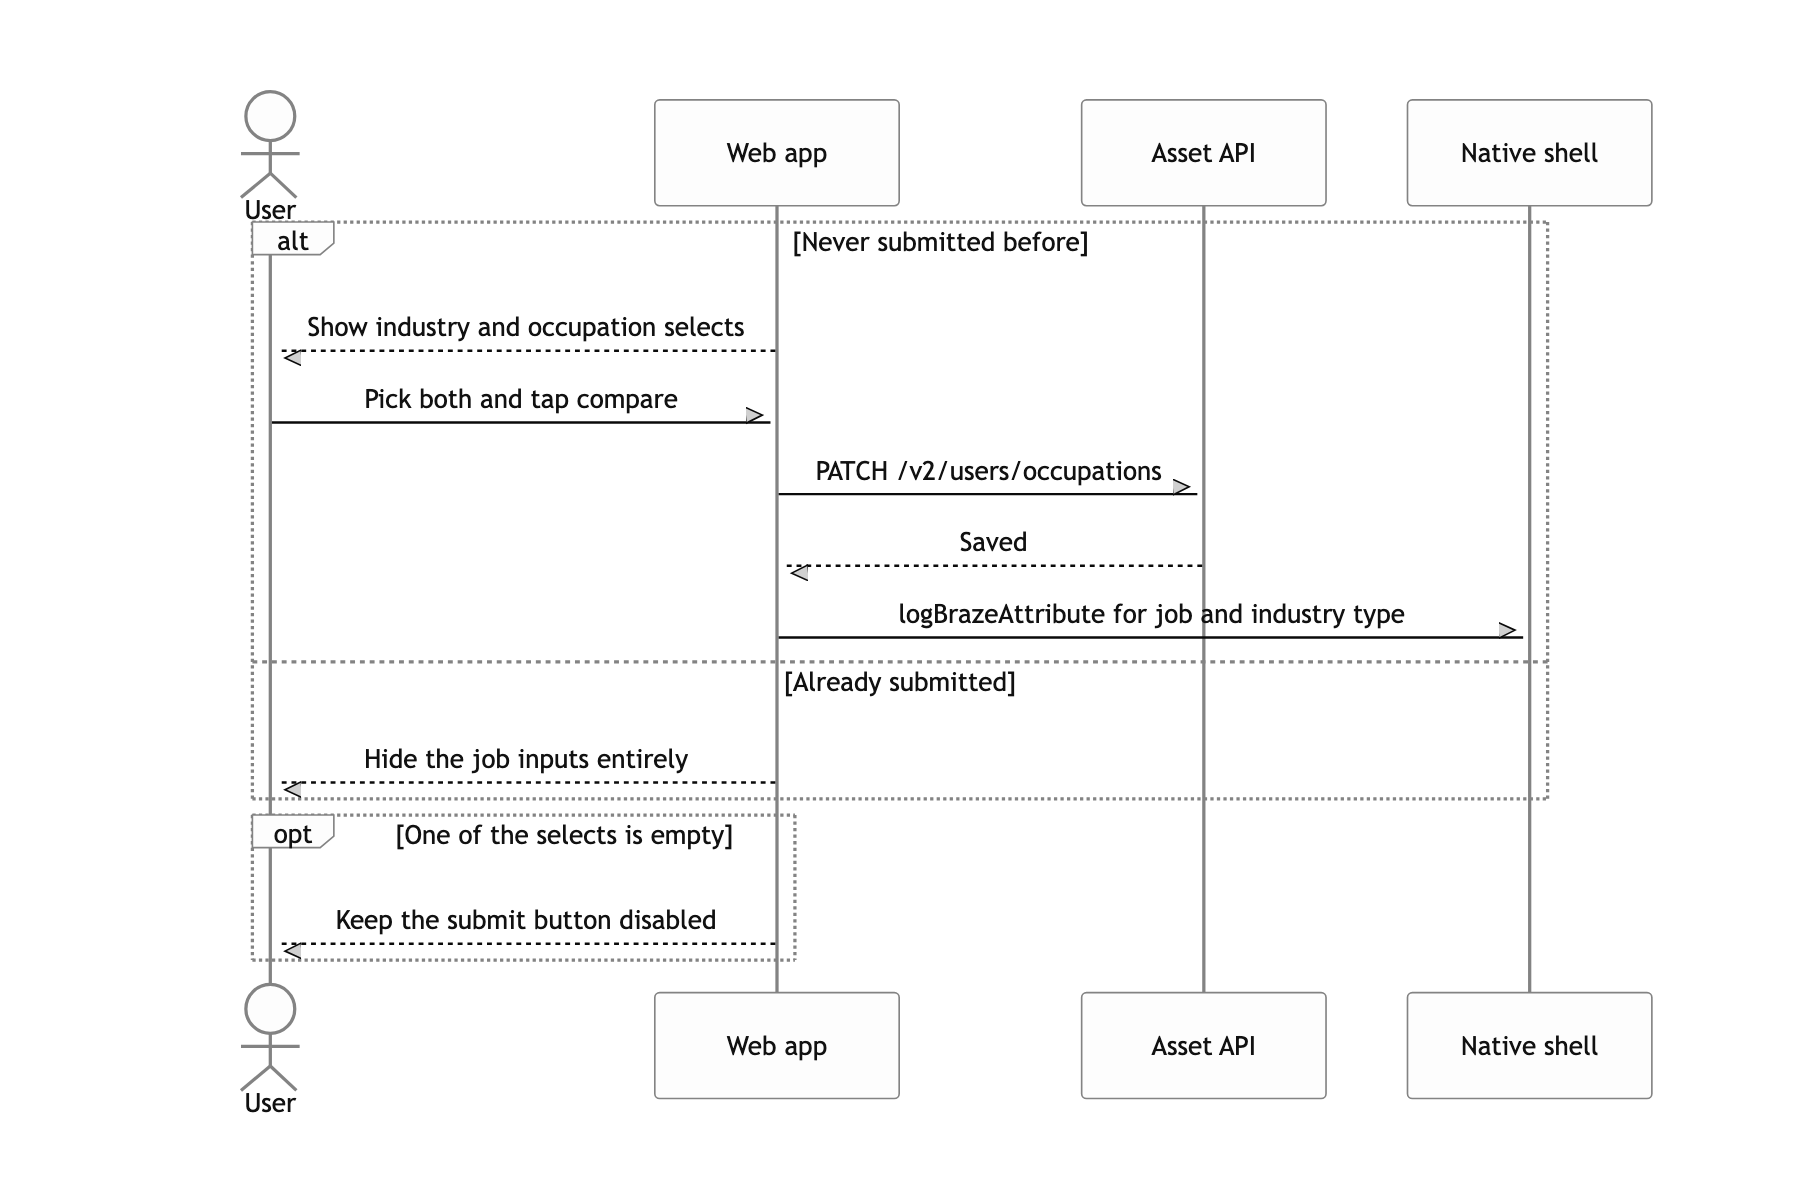
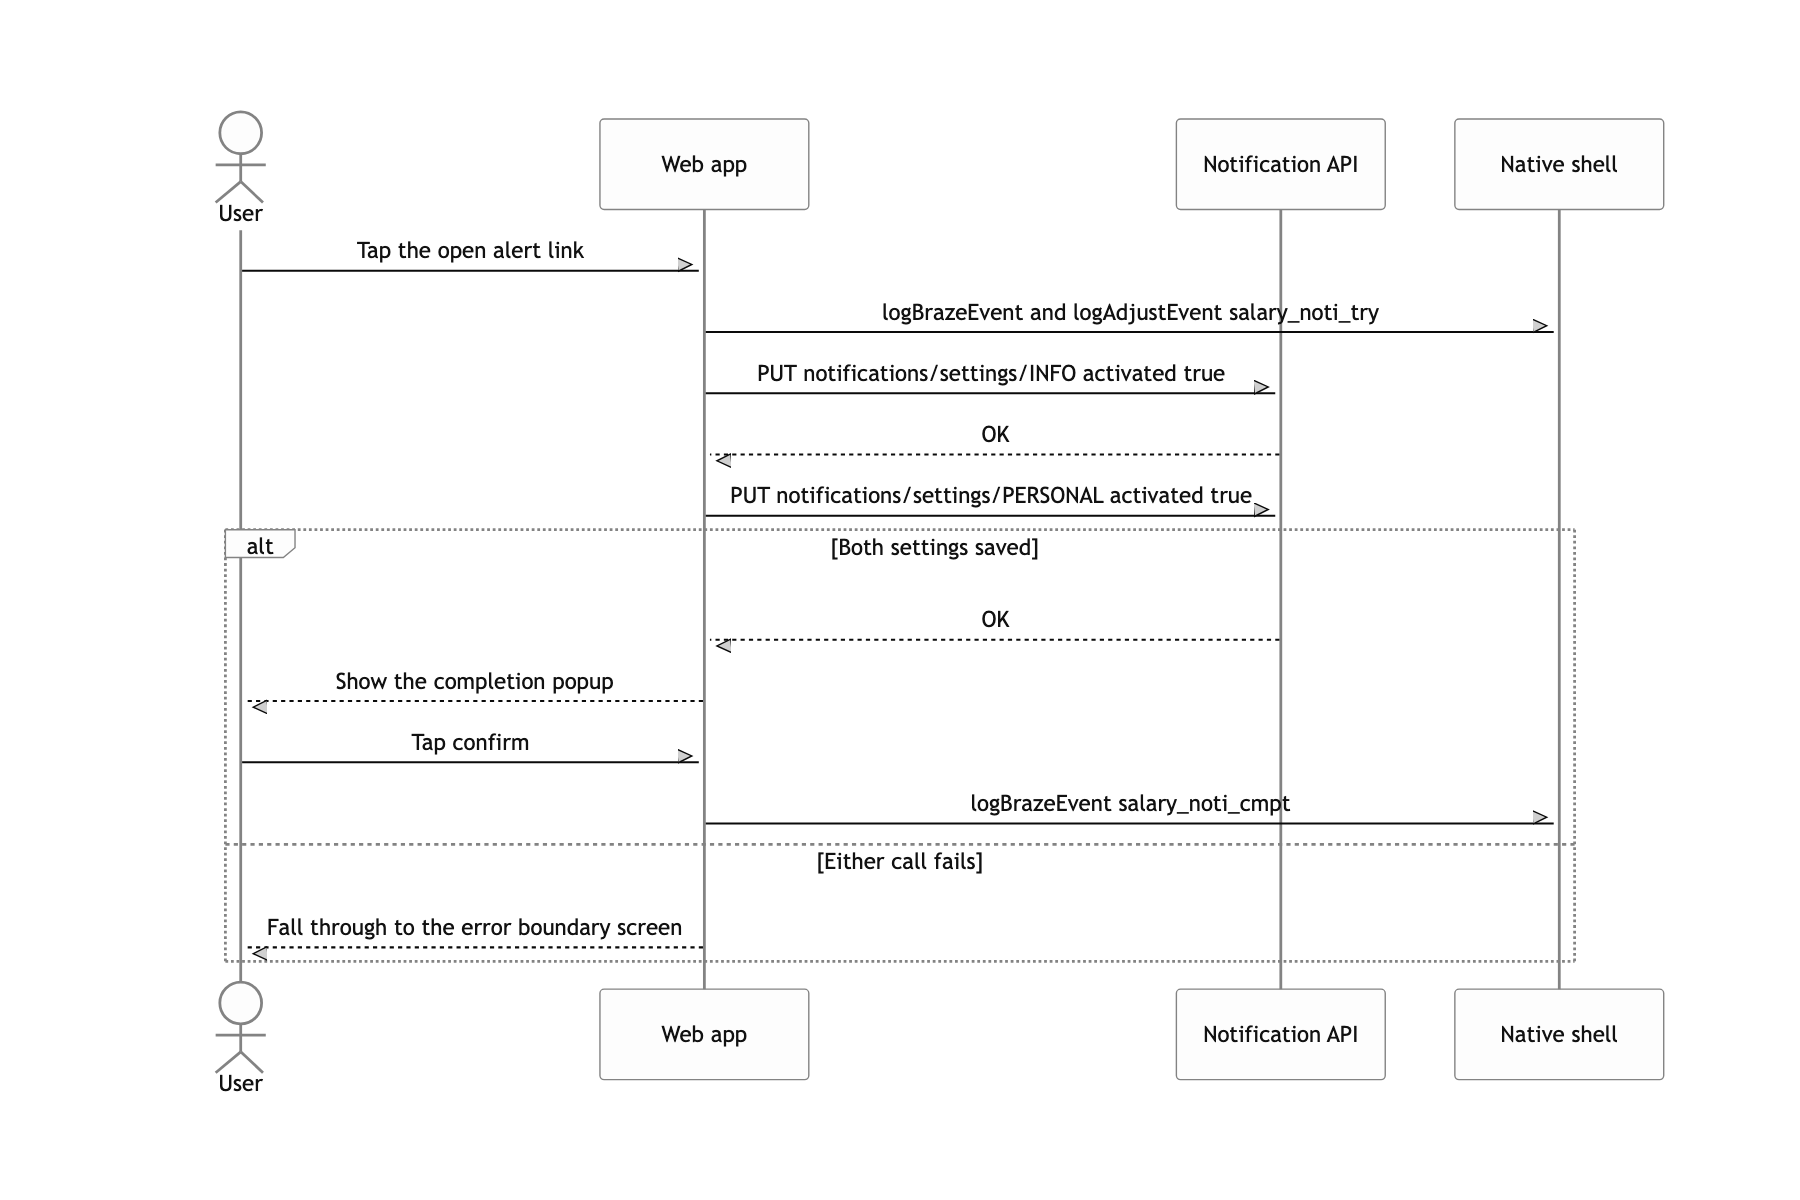
There were three requirements. First, it had to be an event screen that could be attached and detached from the app. Second, it had to collect industry and occupation once on that screen (it is patched to /v2/users/occupations). Third, it had to also take an opt-in for launch notifications about the follow-up "salary by occupation" feature.
So the screen is statistics content, the place where occupation data is collected, and the place where the notification opt-in is taken. There is only one screen, but seven requests go into that one.
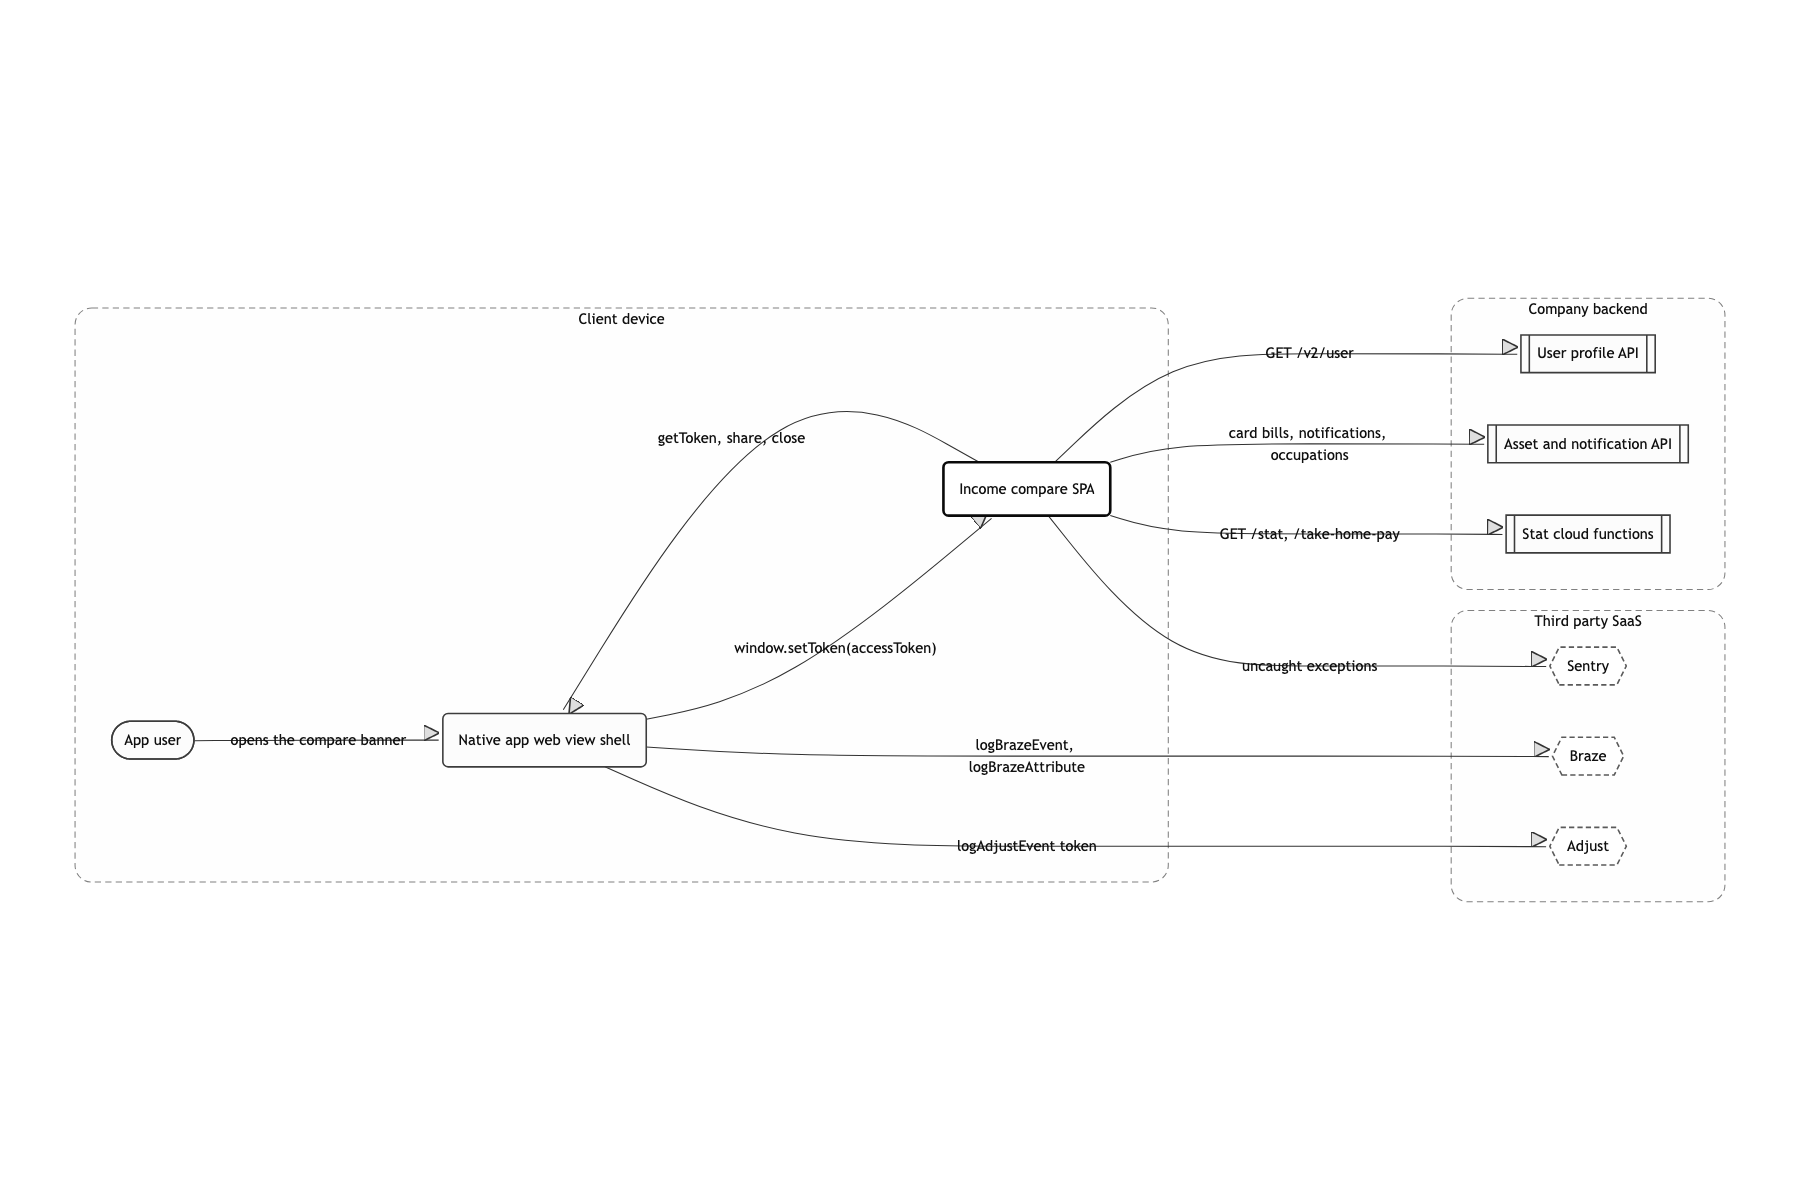
Native passes the token, web does the rest
A single-page CRA app in a web view instead of a native screen
Going back through app review every time the event copy or the reference year changed was not an option. I picked the option where uploading a static bundle to S3 ships to iOS and Android at once. The web has no login session, though. How to hand authentication over became the very next problem.
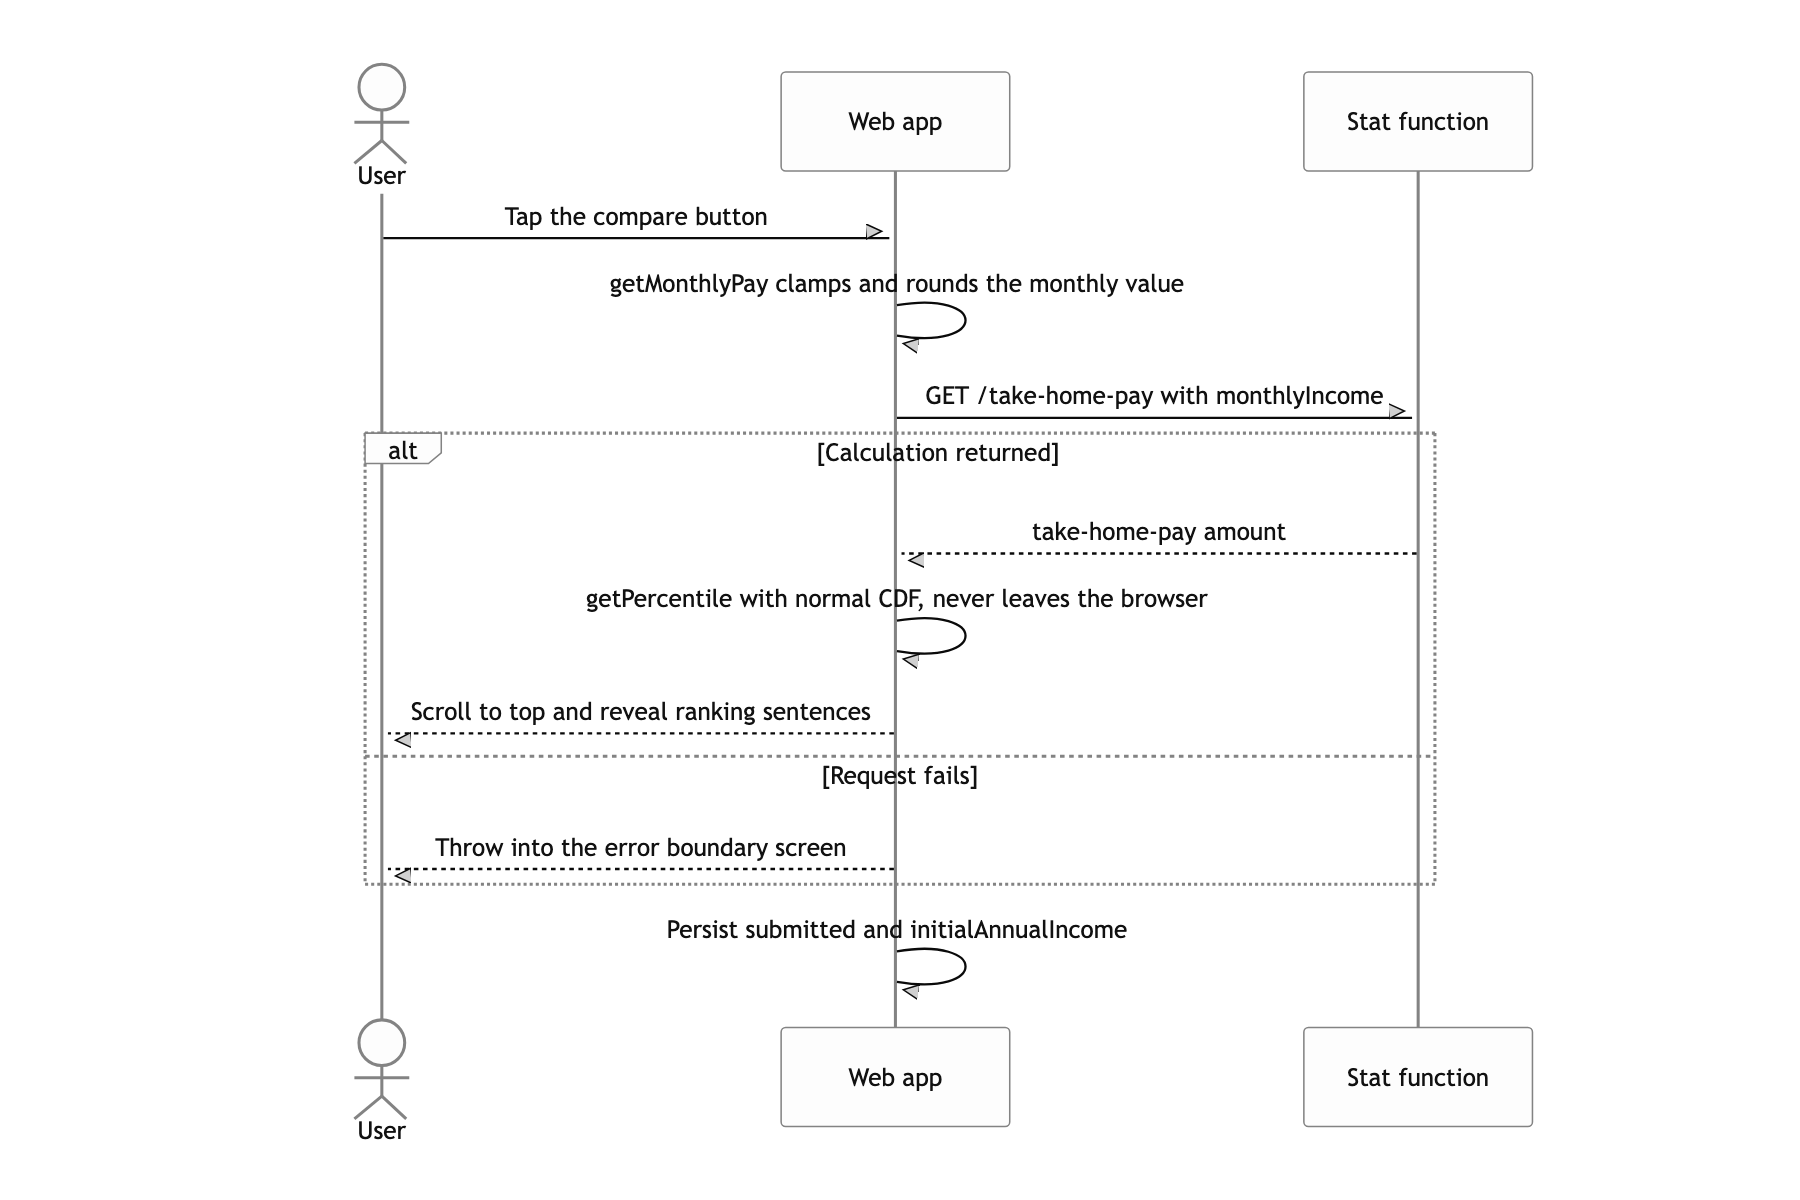
Splitting the averages, standard deviations, and take-home pay math into separate Cloud Functions (/stat, /take-home-pay)
Serving a 2019 aggregate snapshot and working backwards through the four national insurances and income tax was not the main API server's job. And the event schedule was far too short to ride the app backend's release train. The main API (REACT_APP_API_HOST) and the stat functions (REACT_APP_FUNCTION_HOST) sit on different origins, so the front end has to hold both hosts at once.
Computing the percentile on the client with a jStat normal CDF, not on the server
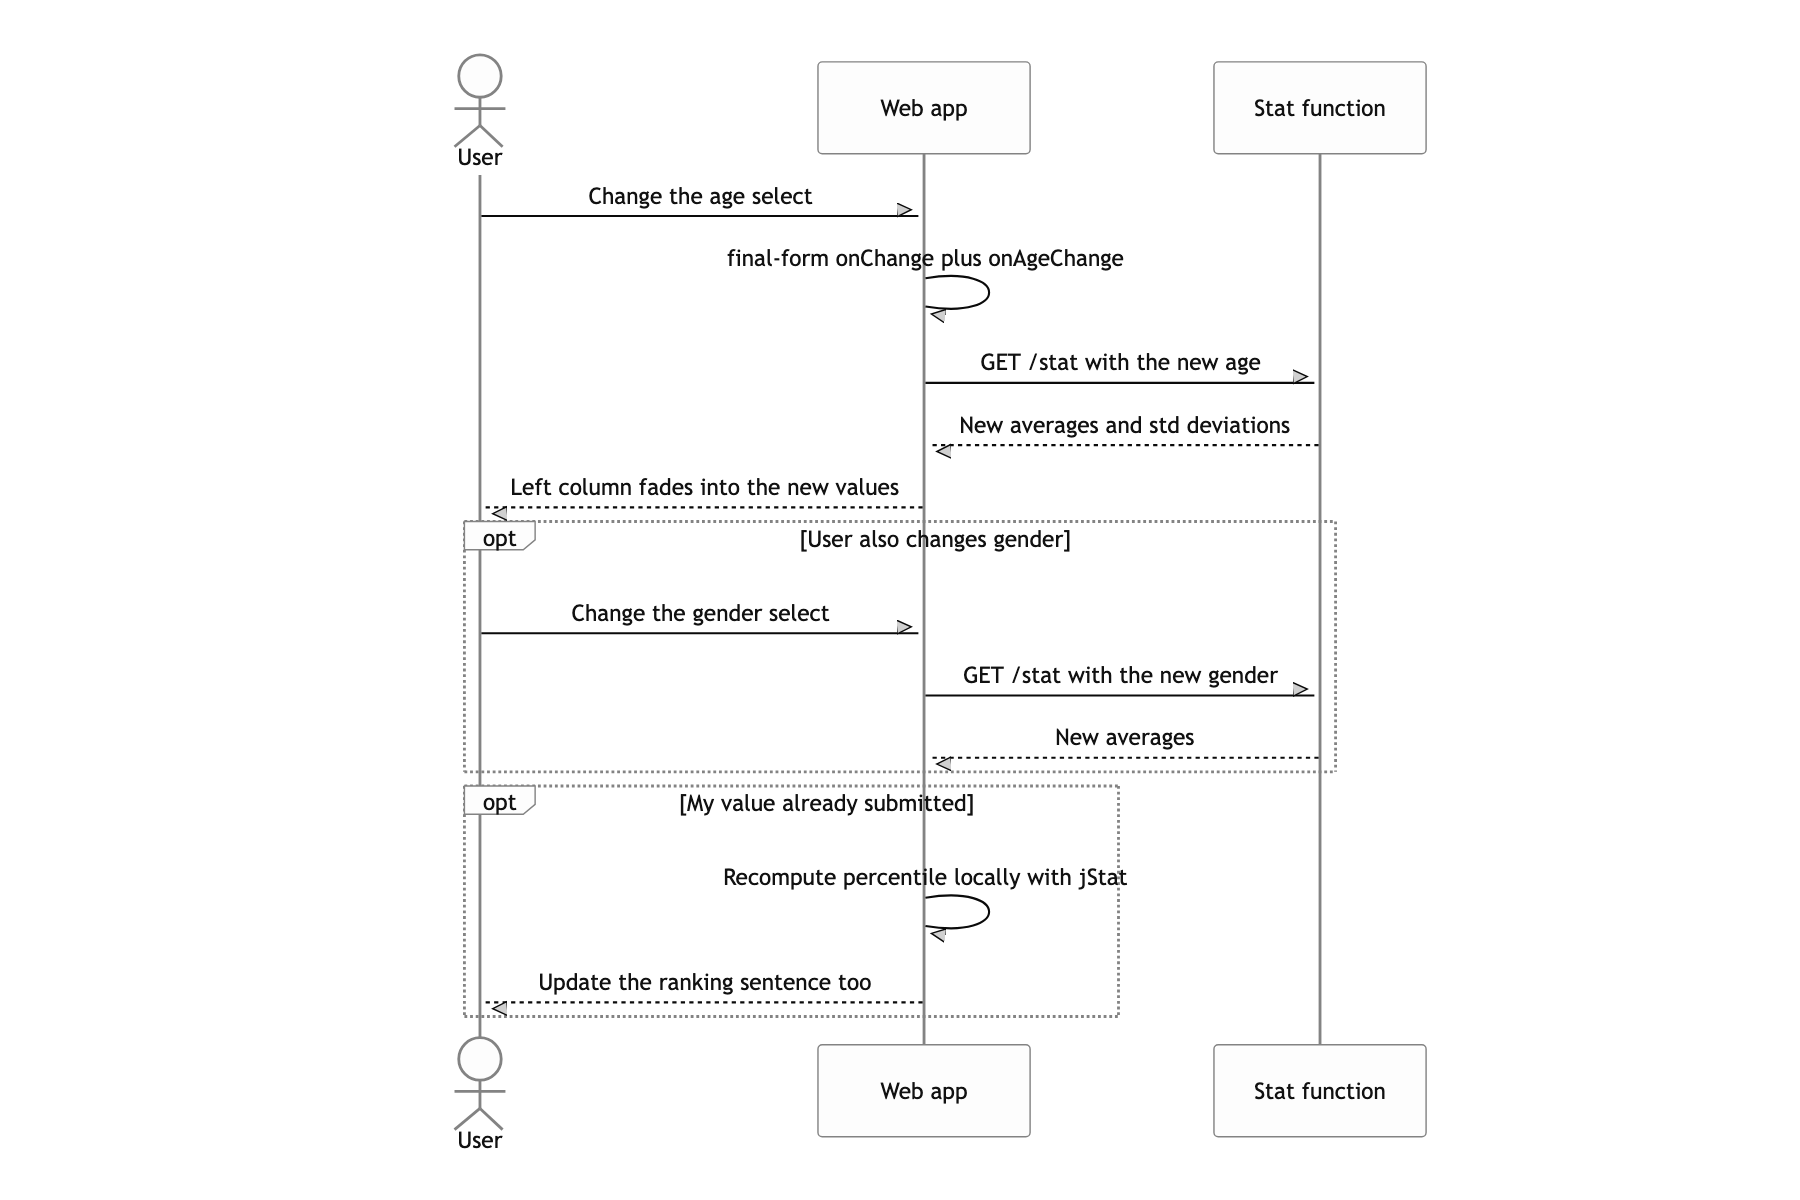
The server only has to return the average and standard deviation for each gender and age bucket. The round trip that would refetch a percentile every time someone fiddles with the age or gender select disappears, so the number moves with them instantly. I did not want to send the raw salary the user typed to the stat server. Sensitive values never leave the browser.
styled-components plus MIXIN.autoSize(px) to convert every dimension to vw
The design was drawn on a 375pt frame, and I wanted it to stretch proportionally inside web views of every width. One line of vw, (px * 4) / 15, replaced a pile of media queries. The native side decides the web view height; only the width follows the device.
Building per environment with env-cmd in GitHub Actions and copying straight to S3
Creating a release goes to the staging bucket, and a push to production goes to the production bucket. A deploy pipeline that ends at one aws s3 cp --recursive was the right size for this. Values that differ per environment, like the Adjust event tokens, are branched inside getEventToken on REACT_APP_ENV.
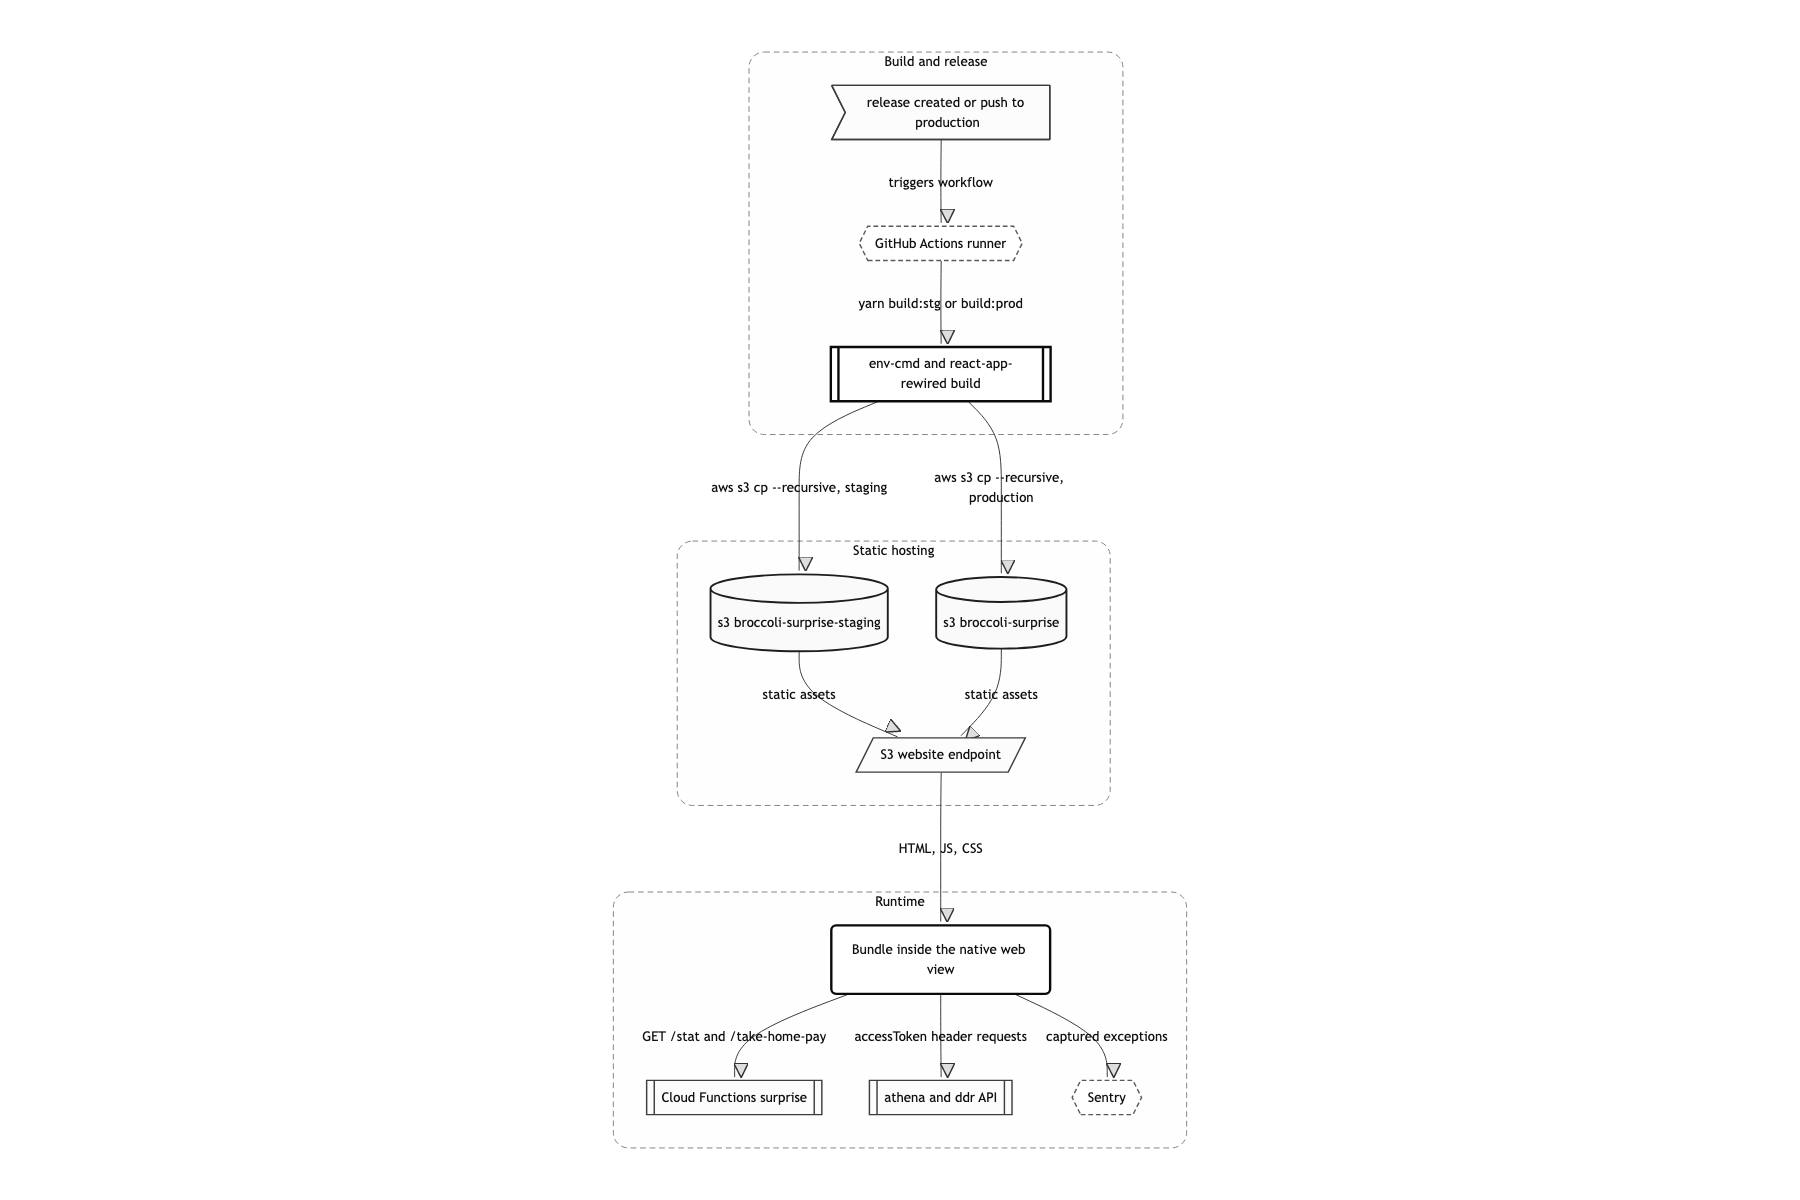
One static bundle, three backends
The structure is simple. One static bundle on S3 opens inside a native web view, and from there requests fan out three ways.
Authentication first. The page boots without knowing the token, so the moment it starts it plants window.ee (an EventEmitter) and window.setToken on the global object and then asks native for a token. Until the token lands, the screen is nothing but <Loading />.
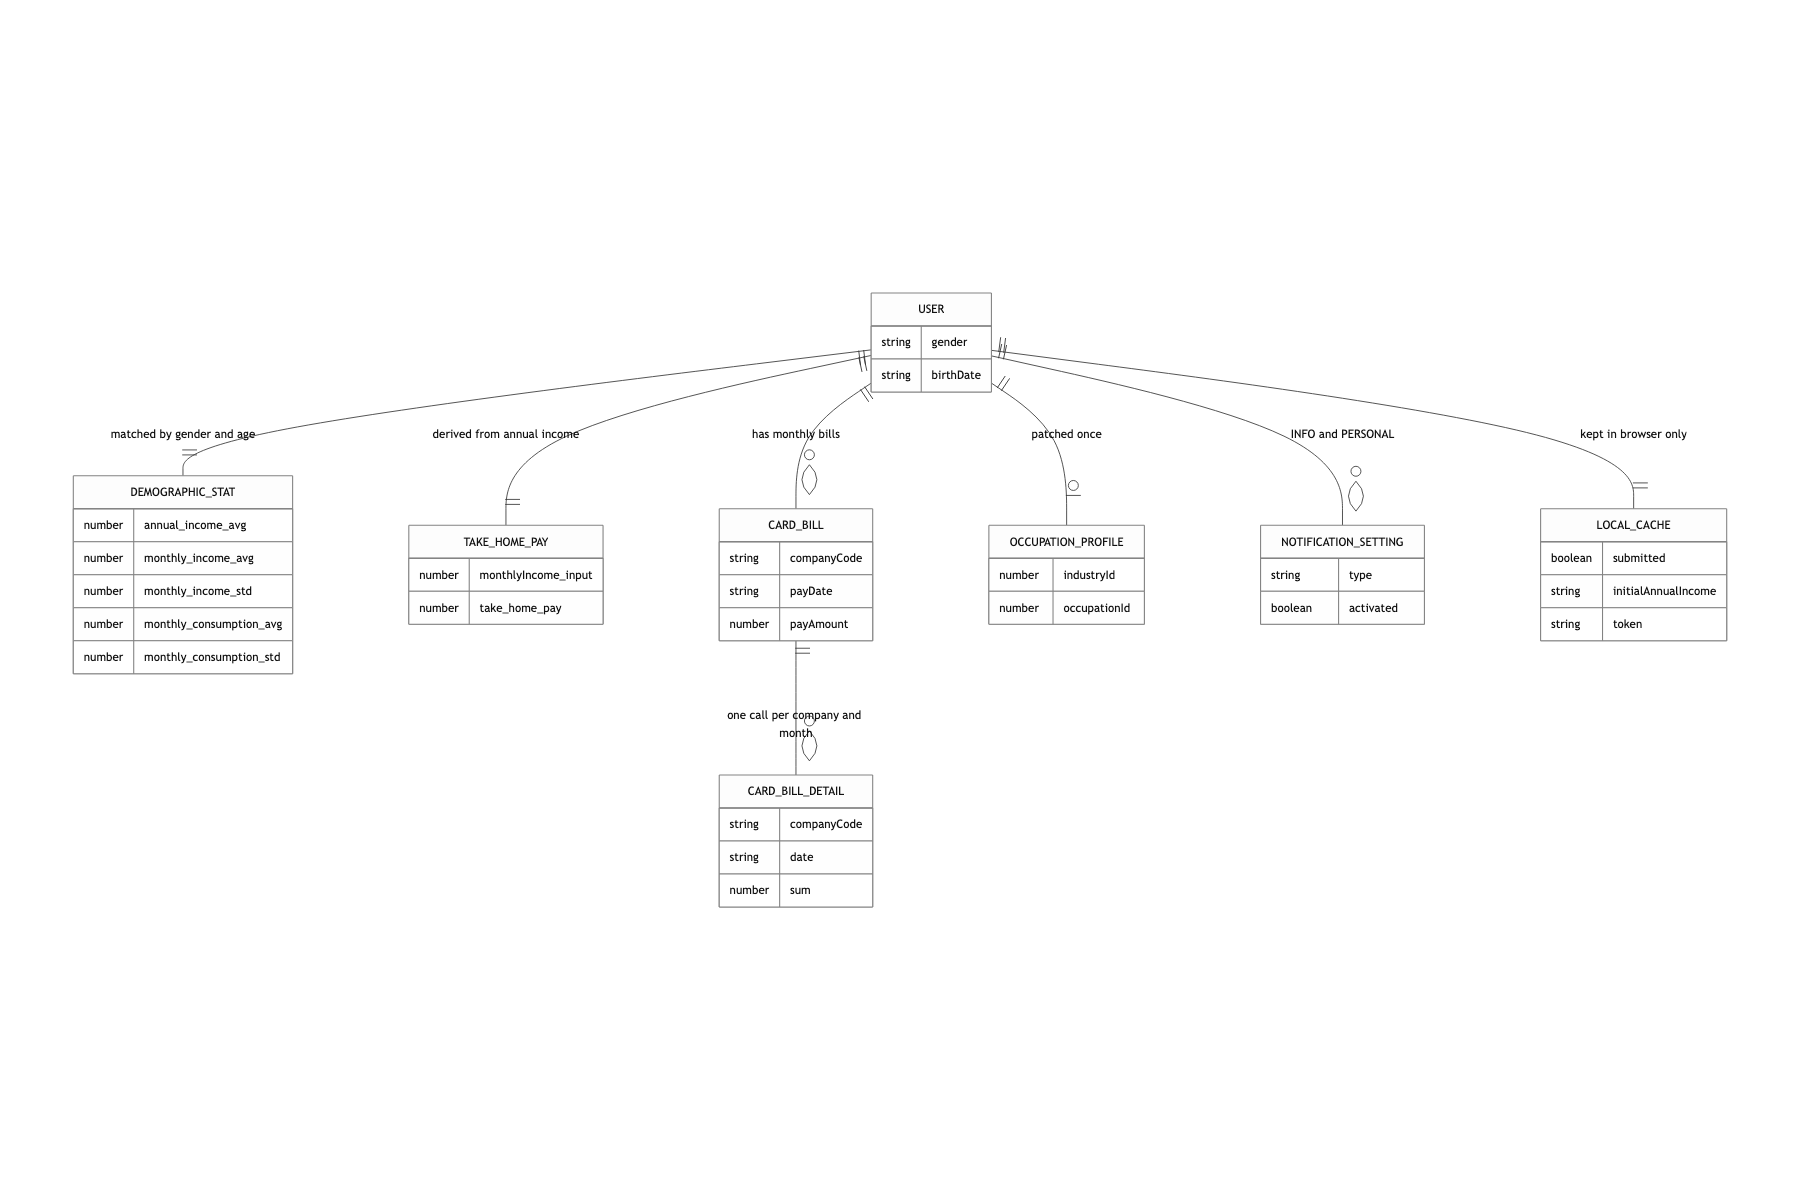
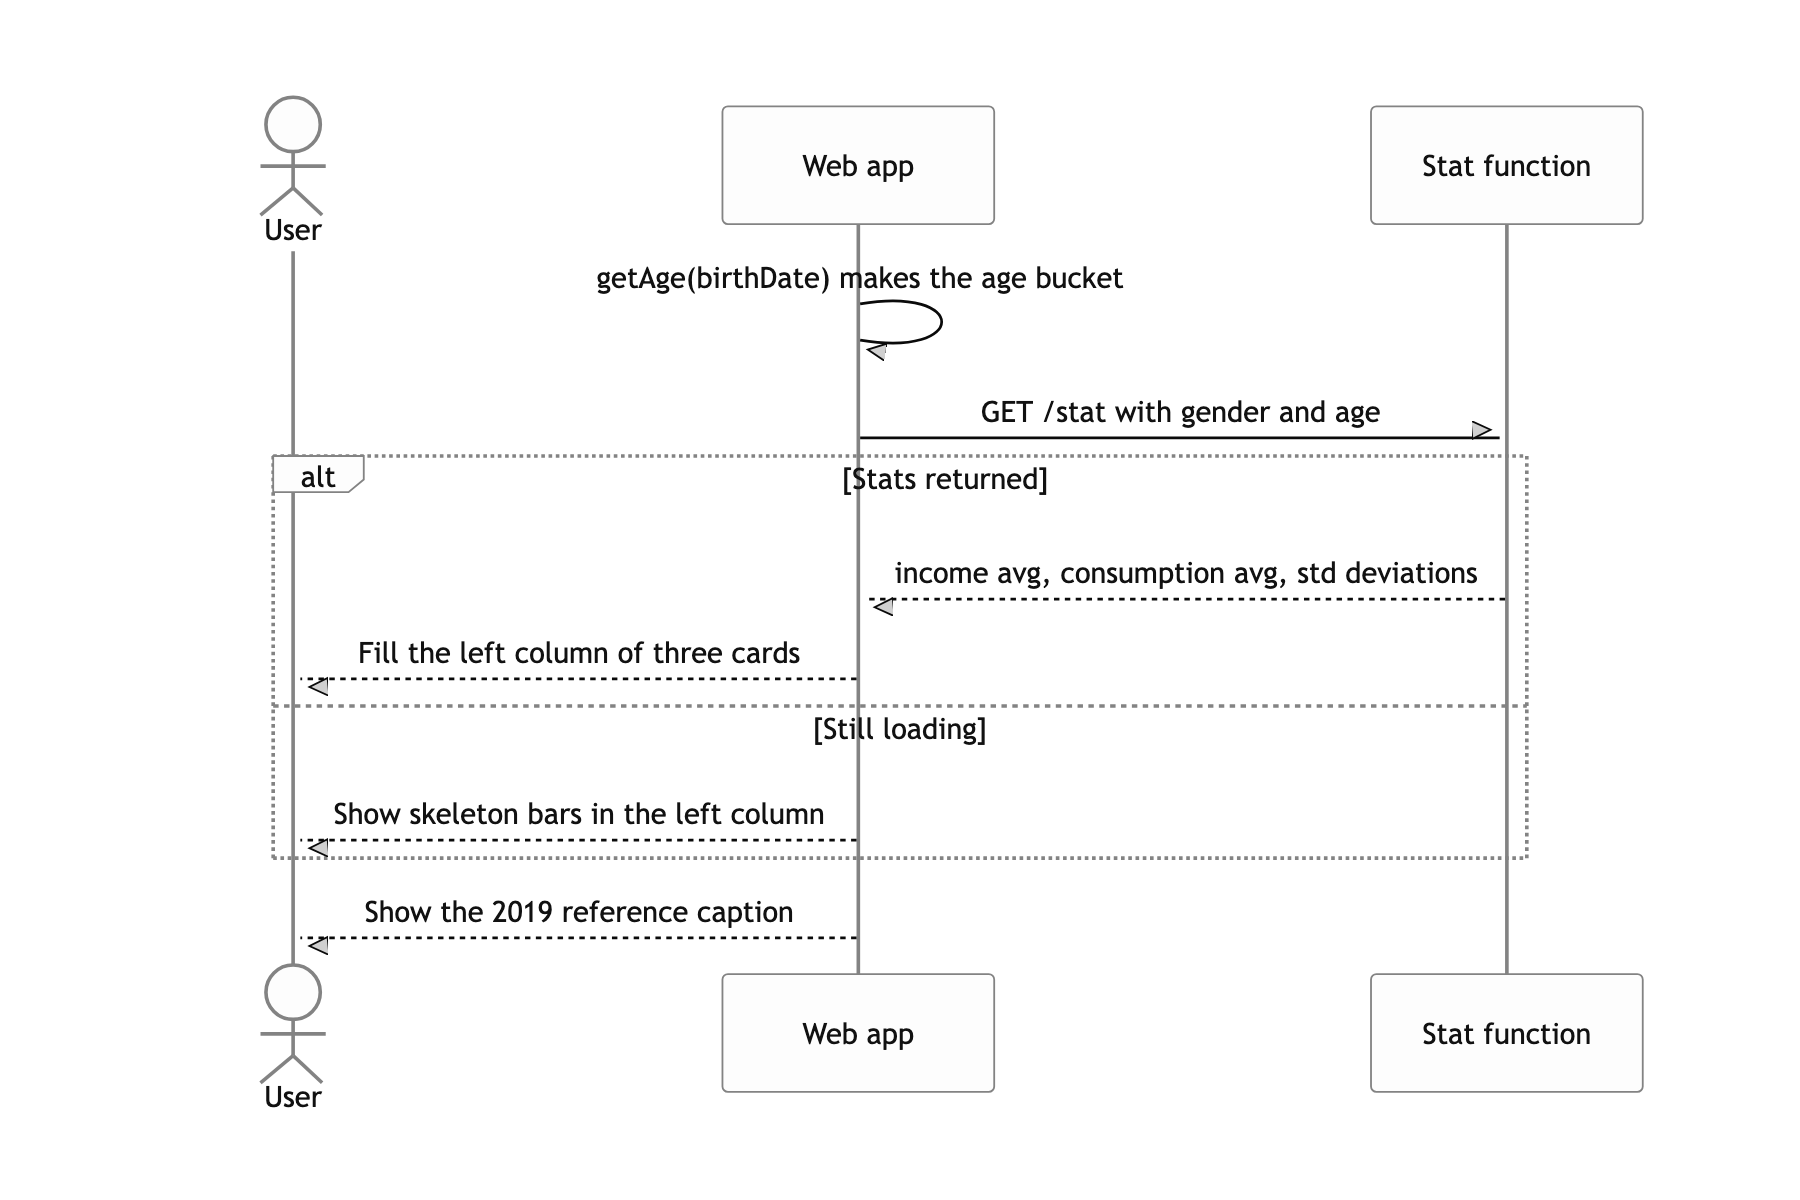
Once the token arrives, the page talks to three kinds of servers. The user profile API (ddr) returns birth date and gender, which become an age bucket, and the stat Cloud Functions return the average and standard deviation for that bucket and gender. The card billing API (athena) returns the statement list and the per-company detail, which become the average spending over the last two months. That is the left column (the average) and the right column (me).
The comparison itself never goes to a server. getPercentile computes the top percentage in the browser with jStat's normal CDF, and getScaleText assembles a sentence like 상위 23%, 평균보다 카드소비금액이 12만원 낮습니다 (top 23%, your card spending is 120,000 KRW below average) and pins it underneath.
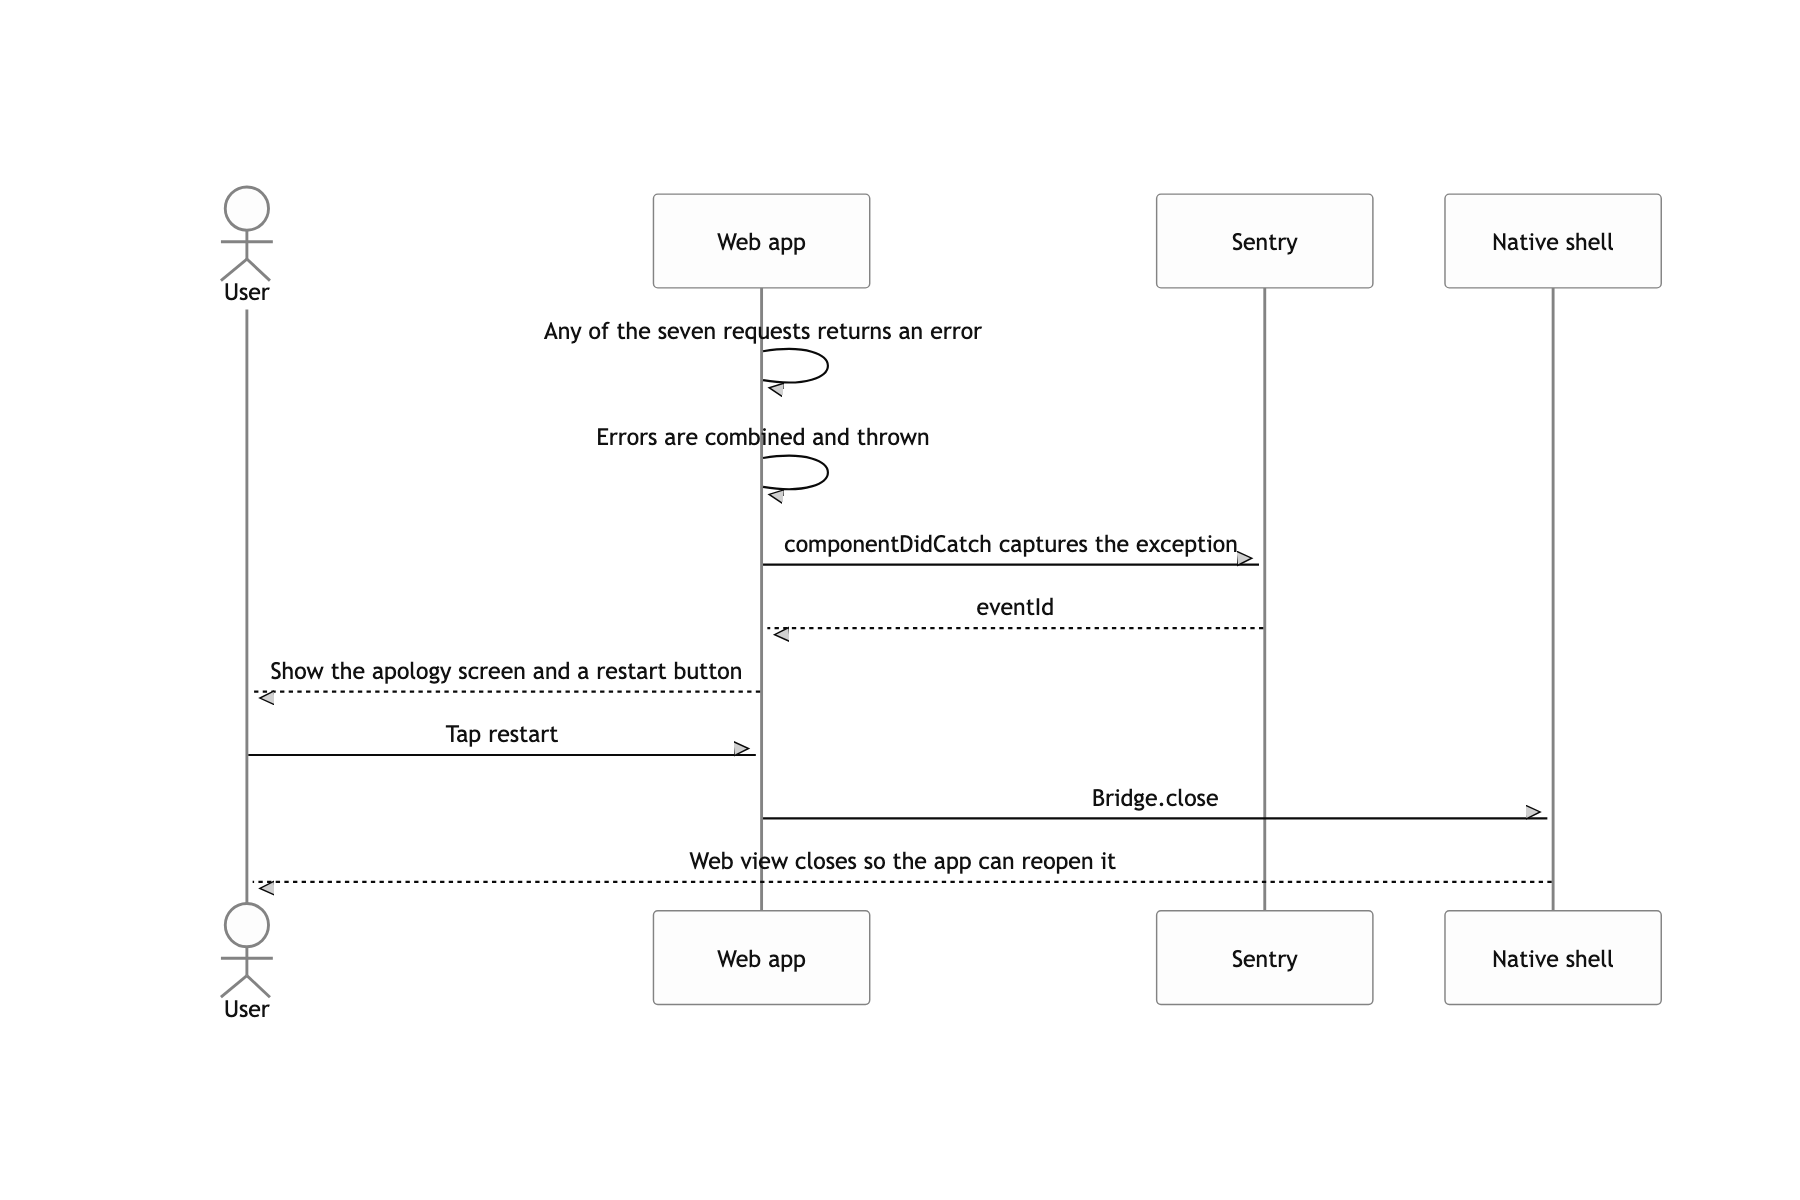
At submit time things flow the other way too. Industry and occupation are patched to the main API, and the Braze and Adjust event tokens are not fired by the web page itself but handed through the bridge to the native SDKs. Exceptions thrown in the web page are caught by an ErrorBoundary and sent to Sentry, and the user is shown a single 다시 시작하기 (restart) button.
Waking a screen that gets its token late, without polling
The easiest way to hand a token to a web view is the query string. Open it with ?token=... and the front end has to do nothing at all. The next most common way is polling with setInterval until native writes the value into localStorage. The first leaves the token sitting in the URL, in the web view history, and in the referrer. The second gives you a screen that wakes up whenever it happens to wake up.
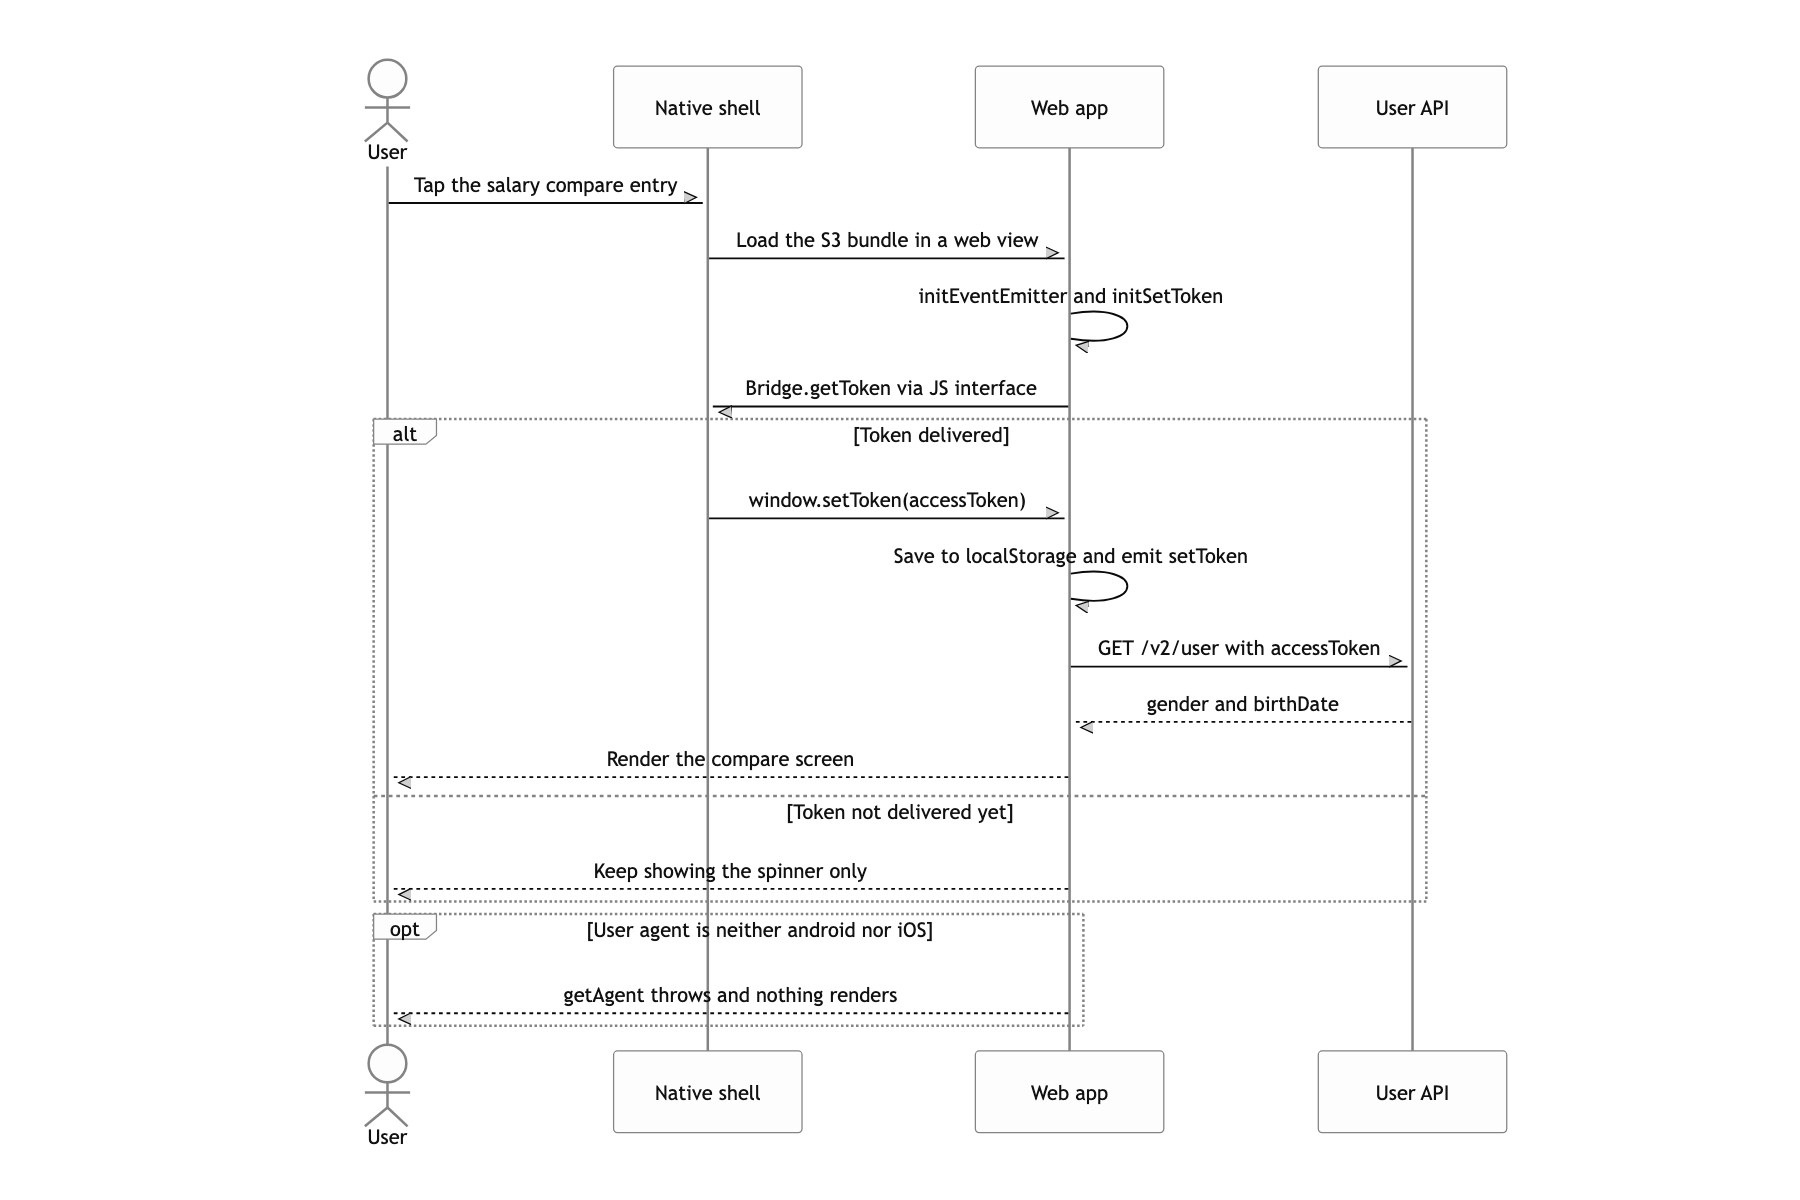
I inverted the order. As soon as the app mounts, Bridge.initEventEmitter() and Bridge.initSetToken() plant window.ee and window.setToken first, and only then does Bridge.getToken() call native. Native calls window.setToken(token) the moment it is ready, and inside that the token is saved to localStorage and emitEvent('setToken') fires. React picks the event up through a listener, updates state, and only then renders the real screen. While there is no token the whole thing is one line, if (!token) return <Loading />, and on unmount the listener is removed and the token cleared from localStorage together. Android goes through window.broccoliWebview.* and iOS through window.webkit.messageHandlers.broccoliWebview.postMessage, and that branch lives only inside getAgent().
The point is the ordering: registration before request. However fast or slow native answers (the iOS mock bridge deliberately waits four seconds), the callback is already on the global object, so the event is never missed. The polling-interval lag goes away, and so does the token in the URL. In development, initBridge() swaps the whole interface for a mock with the same shape, so I could build the screen in a browser without ever building the app.
One month of statements is not enough to say what someone spends
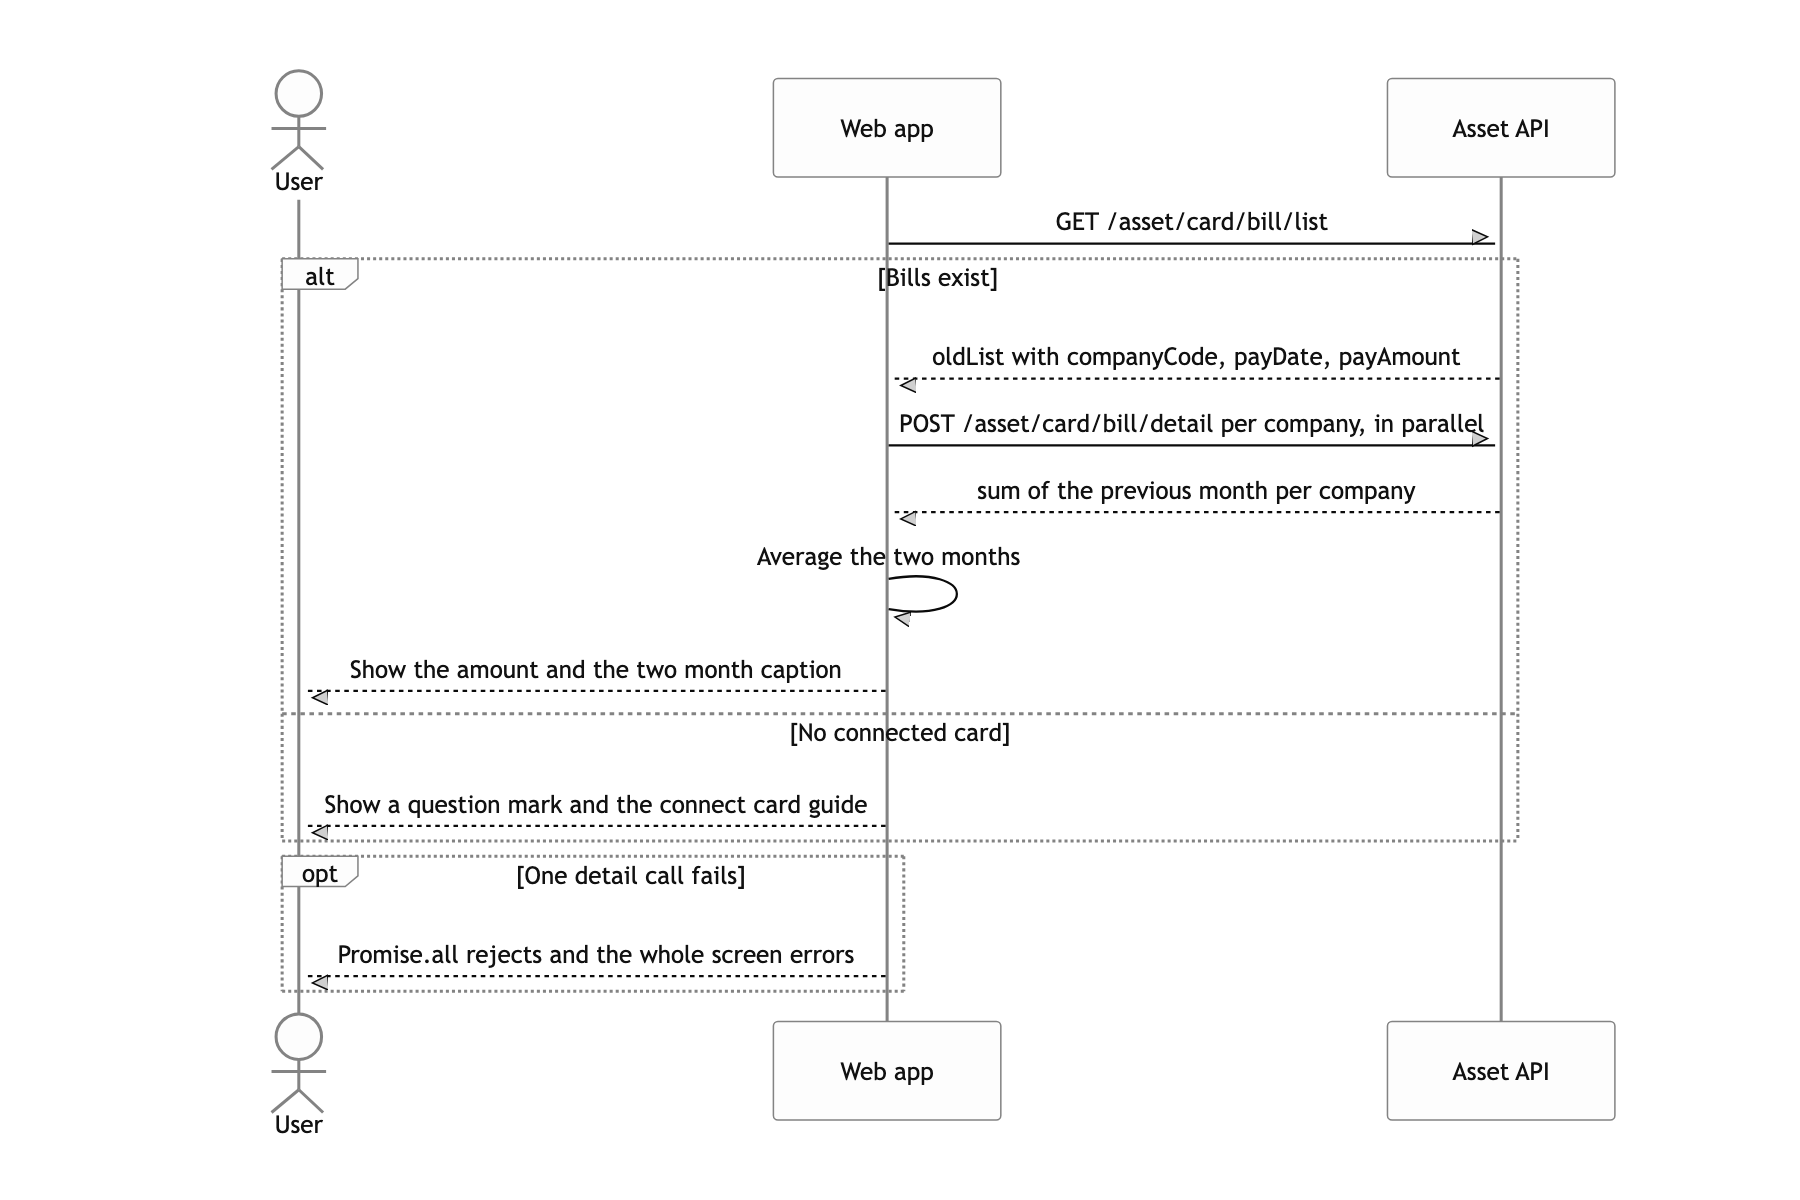
The statement list API (/asset/card/bill/list) returns oldList. Add up every payAmount in it and you have 'my card spending', and it is tempting to compare that straight against the average. But that list is a single billing cycle for the previous month, so anyone whose month held a holiday or a trip sees an inflated number for themselves. Go the other way and fetch the month before by awaiting per-company details sequentially inside a for loop, and a user with four cards eats four times the wait.
In getMonthlyCardBill I pull companyCode and payDate off each list entry, turn the YYYYMMDD string back into $1-$2-$3, subtract a month with moment, and build the detail request body. Those requests get spread with map, handed to Promise.all all at once, and the returned sum values are folded into the previous month's total. Finally I add that to the latest month's total and divide by two for a two-month average. On screen, the line 최근 2개월 청구금액 평균 (average billed amount over the last two months) sits right under that number as its basis.
The list API only gives the most recent month, so the month before it can only come from the per-company detail, and those detail calls have no dependency on each other. Fire them in parallel and the perceived wait converges on the slowest single call, no matter how many cards there are. Averaging two months alone halves the swing of any one month, and it leaves the user less room to think 'I do not normally spend this much'. The right column stays a skeleton until the value arrives, so nobody sees 0원 flash and then change.
What a user can do
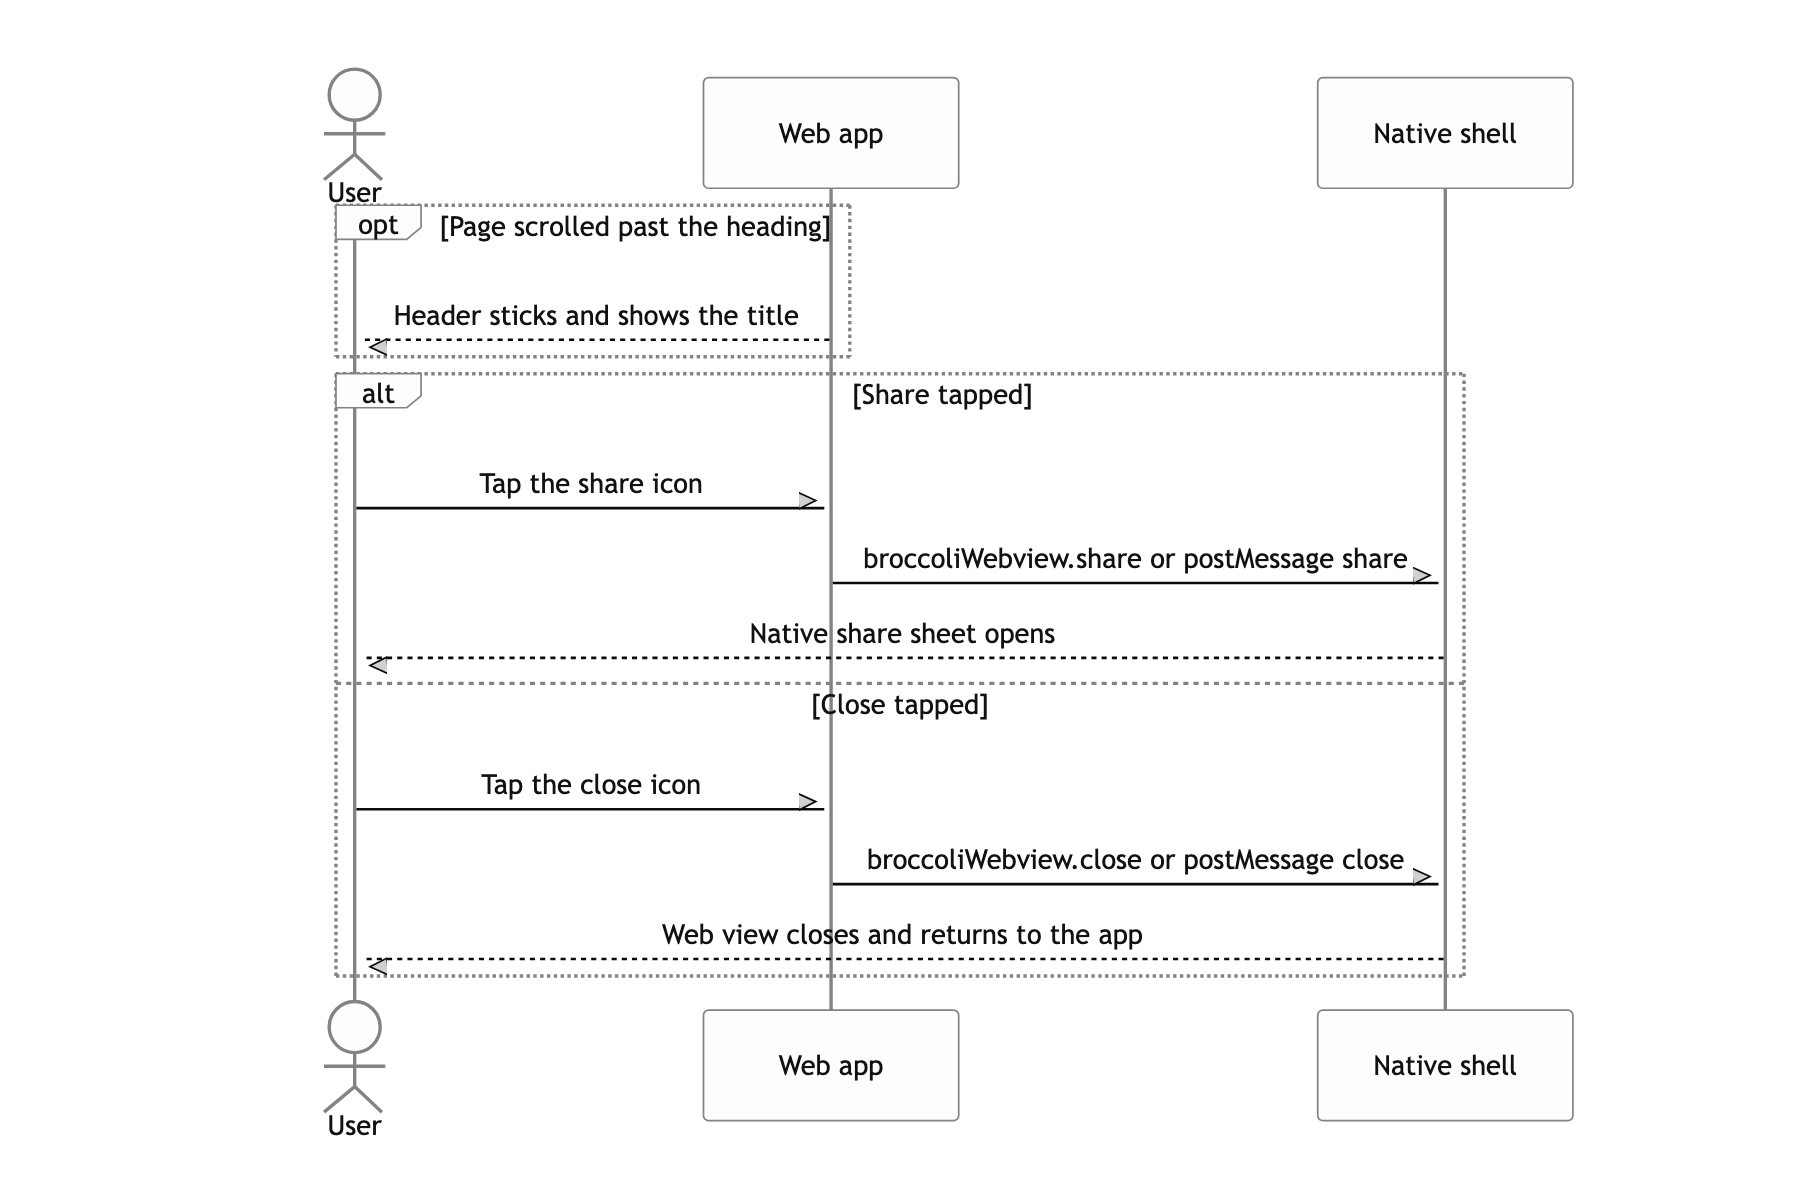
Two months averaged, no tests
Honestly, this screen is pinned to a moment in time. The /** 현재 2월 */ (currently February) comment on the first line of getMonthlyCardBill and the assumption that oldList is always the previous month are the proof. The reference statistics are a 2019 snapshot too, so the copy needs a pass the moment the year turns.
Error handling is worse. Main bundles the errors of all seven requests as demoErr || notiIErr || ... and throws, so one failing card detail covers the entire screen with 앗! @_@ (oops). Promise.all behaves the same way: one dead card company and the two-month average vanishes whole. If I built it again I would keep the partial sums with Promise.allSettled and confine each request's failure to its own piece of the screen. Quietly emptying only the card spending column and showing the rest is far better for the user.
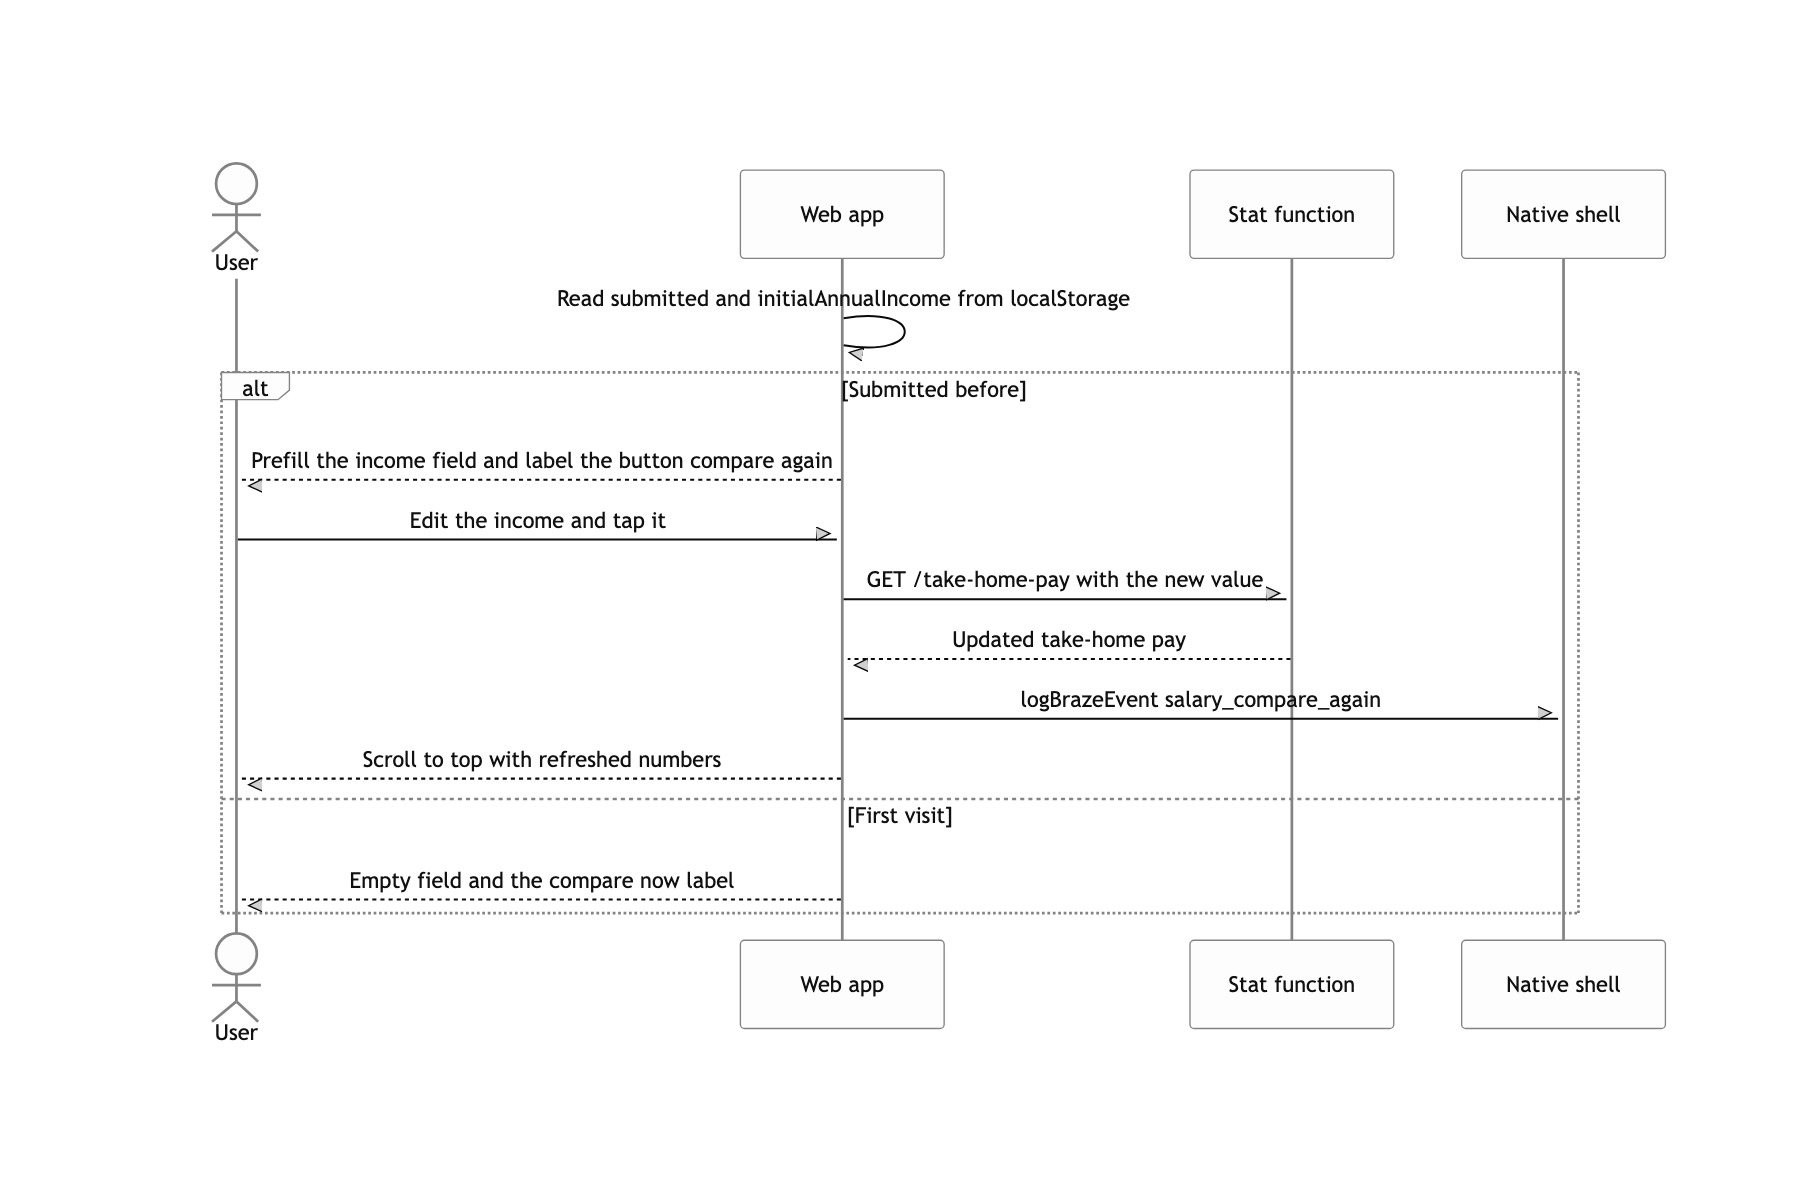
Keeping the token in localStorage was only papered over by clearing it on unmount; today I would keep it in memory only. There is not a single test. The reason was one screen and a short schedule, but the calculations I had already pulled out as pure functions, getPercentile and getMonthlyPay, were the easiest place in the codebase to attach tests, and I still did not. Having no router, so the whole screen state rides on localStorage flags like submitted, also made it hard for QA to reproduce a specific state.
